
Since August 31, 2026, any company established in Europe can create an advertising campaign in ChatGPT. OpenAI’s Ads Manager became self-service in France and around thirty European markets, one week after an opening reserved for partner agencies. The structure is familiar: campaigns, ad groups, ads. The objectives are less so: targeting is not based on keywords but on contextual indexes describing the targeted conversations, without advanced personalization in Europe. Billing is done on a CPM or CPC basis, with advertised costs per market click between $3 and $5 and no minimum budget.
The arrival of a new advertising channel automatically triggers the same question in management committees: how much should we put into it? There is another, less spectacular and more useful, that almost no one asks: before paying to appear in ChatGPT, what does ChatGPT already earn for free?
The data exists. They sleep in Analytics accounts, under a line that no one looks at because it’s too small.
Three sites, three times the same surprise
The following figures come from real Google Analytics 4 accounts, taken over twelve rolling months, from September 1, 2025 to September 1, 2026. A French e-commerce site for office furniture, an online training organization which operates two sites, one French and one English, for France and Canada, and the site of the author of these lines. Three sizes, three economical models.
An important common point: none of these three sites have undergone any optimization work for generative engines. The first two are accounts monitored in Google Ads advertising, not in SEO. What follows is therefore not the result of a strategy, it is a floor.
E-commerce: 0.57% of traffic, 0.80% of turnover
Out of 94,713 sessions and 391,221 euros in turnover recorded in twelve months, ChatGPT sent 543 sessions. A drop in the bucket: 0.57% of traffic. This is usually where the analysis stops and the row returns to the bottom of the table.
These 543 sessions generated 3,117.69 euros in turnover, or 0.80% of the total.
Reported to the session, the difference becomes clear. A session from ChatGPT brings in 5.74 euros. A session from Google brings in 4.58. The site average is 4.13 euros. The most marginal channel on the site is also the most profitable per visit, 25% above Google and 39% above the average.
Engagement tells the same story. These visitors trigger 21.4 events per session, compared to 8.2 for those from Google.
The shift took place in the first half of 2026
By cutting the year in half, we see something other than market share: we see a transformation.
Between September 2025 and February 2026, ChatGPT had sent 163 sessions to this site. Average duration: 29 seconds. Events per session: 5.2. Attributed turnover: zero euros.
Between March and September 2026, there are 382 of these same visitors. Average duration: 2 minutes 35. Events per session: 28.3. Attributed turnover: 3,118 euros.

Sessions sent by ChatGPT and attributed turnover, e-commerce site, comparison of the two semesters. Source: Google Analytics 4.
The volume has doubled, which is already noticeable. But it is the nature of the traffic that has changed. We went from curious people who bounce around to visitors who browse the catalog and buy. Over this second half, a ChatGPT session brings in 8.16 euros compared to 5.18 euros for a Google session, or 1.6 times more.
The training organization: the gap is in the English-speaking market
The second case is an online training organization. It does not sell directly, it generates registration requests, tracked as key events. Useful feature for analysis: it operates two sites, one French-speaking and one English-speaking, combined in the same Analytics property. Out of 80,025 total sessions, the breakdown by host name reveals what an aggregated figure would have hidden.
On the French-speaking site, Google provides 35,084 sessions, with a key event rate of 15.28%. ChatGPT brings 164, at 15.85%. Draw.
On the English site, Google provides 11,249 sessions, with a key event rate of 4.48%. ChatGPT brings 175, at 14.29%. That’s a ratio of one to three.
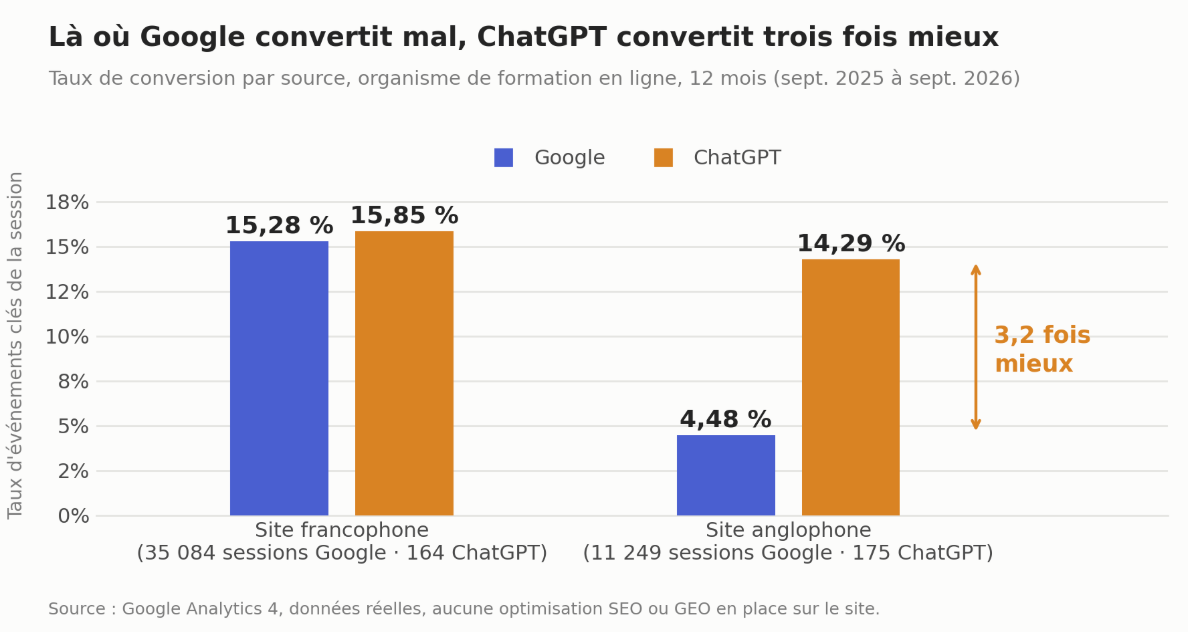
Key event rates by source and market, online training organization, 12 months. Source: Google Analytics 4.
Two observations arise from this. First, ChatGPT sends as many sessions to the English-speaking site as to the French-speaking site, while Google sends three times as many to the French-speaking site: the linguistic distribution of generative traffic does not copy that of the search engine. Then, the advantage of this channel does not manifest itself in the same way everywhere. It is zero where the site is already well served by Google, and considerable where it is poorly served.
Note in passing, on the student space of the same organization, 27 sessions from ChatGPT display nearly 4 minutes of engagement and 21 events per session. Users who ask an assistant how to connect to their course space, and who arrive at the right place.
The small site: the highest share of the three
The third case is the site of the author of this article, 1,600 sessions over the year. The shoemaker here is the worst shod, and that is precisely what makes the figure interesting. At this scale, each value requires statistical caution. It still deserves to be noted: ChatGPT represents 1.31% of sessions there, which is proportionally more than in the other two.
The intuition according to which generative engines only concern big brands holds up poorly to observation.
Why is this traffic behaving differently
The explanation lies in where the conversation is in the purchasing journey.
An Internet user who types a query in a classic engine is at the beginning of his work: he will open tabs, compare, eliminate. The site it visits first receives an exploratory visit.
An Internet user who clicks on a link proposed by a conversational assistant has already done this work, or rather the machine has done it for him. He asked his question, obtained a comparison, possibly asked for clarification. When he arrives on the site, the arbitration has largely been made. He doesn’t come to discover, he comes to check and buy.
This is why ridiculous volume produces disproportionate revenue, and why traffic percentage reasoning is misleading here.
This also illuminates the gap between the two sites of the training organization. In a market where a site is well positioned, the search engine already sends qualified visitors to it, and the conversational assistant does not provide much more. In a market where it is poorly positioned, the engine mainly sends peripheral traffic, while the assistant does not think in results pages but in response to an intention. The conversion gap then becomes spectacular.
Two limits to set before making it a strategy
These figures are underestimated. Part of the traffic from AI arrives without an identifiable referent and is included in direct traffic, which accounts for several thousand sessions on each of these sites. The actual volume is higher, in a proportion that no one precisely measures today.
Traffic shares are fragile. A change in robot filtering, an adjustment to consent mode or spam cleaning is enough to change a denominator by several tens of percent. This is why the absolute values, 163 sessions becoming 382, say something more solid than a share going from 0.25% to 1.34%.
What changes when opening a ChatGPT Ads account
The OpenAI management comes with constraints that advertisers used to Google Ads will discover: no targeting by keywords, no native CRM connector, an attribution that is still imprecise. In other words, a channel that is difficult to control finely at launch.
In this context, knowing the performance of your organic ChatGPT traffic is not a detail, it is the only benchmark available. A site whose visitors from ChatGPT convert twice as well as the average does not approach this new channel like a site which receives none.
The operation takes ten minutes in GA4. Report Traffic Acquisition, Session Source dimension, twelve month period, then reading the lines chatgpt.com, perplexity.ai, gemini.google.com, copilot.microsoft.com and claude.ai. For a multilingual or multi-domain site, add the host name in the secondary dimension: this is where the differences that count are hidden. Compare their key event rate and revenue per session to Google traffic. Look at the evolution between two semesters rather than the total. And keep in mind that direct traffic hides part of it.
There remains an open question, which the coming months will resolve: what happens to such a qualified organic channel when advertising is installed above the responses? The history of natural referencing suggests an answer. All the more reason to measure now, while the baseline is still readable.
This analysis was carried out by Yannick Ansquer, SEO and Google Ads consultantfrom its clients’ Analytics accounts. It supports companies in their acquisition of traffic, both in advertising and in natural referencing.
